The Great Axis Stagnation

The post-1990 stagnation in Japan has been much discussed, analyzed, and ballyhooed. Yet, comparatively little attention has been given to the other Axis powers, Germany and Italy, which are nearly equally stagnant (Italy more so, Germany slightly less). The reason is that Japan’s stagnation started earlier and then decelerated, while Germany’s and Italy’s started and accelerated later. Let us look at the RGDP/worker of these countries in relation to that in the United States (peak=1):
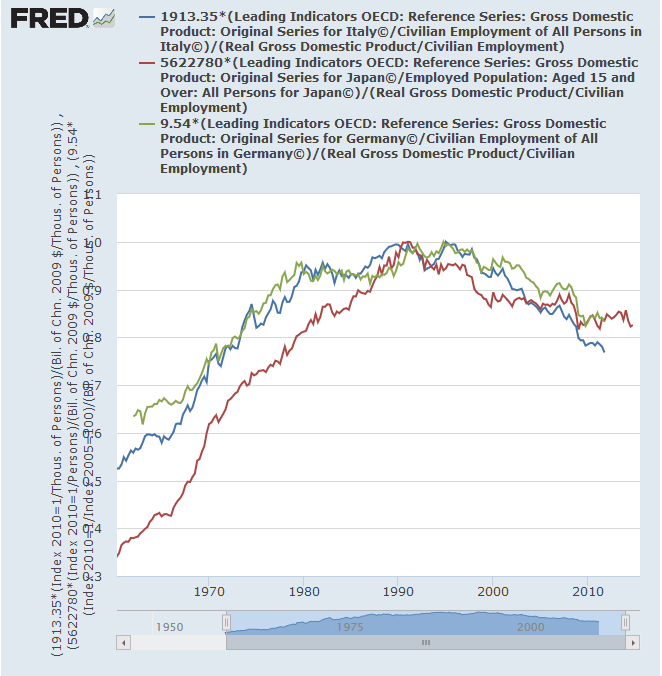
Screenshot (26)
https://fred.stlouisfed.org/graph/?g=p4W3

Compare this to the same variable in, for example, Sweden:
Screenshot (27)
http://research.stlouisfed.org/fred2/graph/?g=1EMr
Basically, Sweden has little more than an exaggerated version of the U.S. trend. So what is going on in the Axis countries?

Whatever it is, it probably has nothing whatsoever to do with aggregate demand, and probably has to do with anything financial only on a tangential level. Since 1995, the highest rate of inflation among the Axis countries has been in Italy, yet it has had the worst stagnation. By simply glancing at inflation, it is clear that Italy only began to suffer unique aggregate demand problems in April 2013-precisely when Italy’s output per worker bottomed out! Also, as pointed out by Mark Sadowski, a huge (and successful) aggregate demand stimulus effort carried out by the Bank of Japan in 2012-2015 failed to significantly boost the rate of real GDP growth, while it did successfully boost the rate of nominal GDP growth.
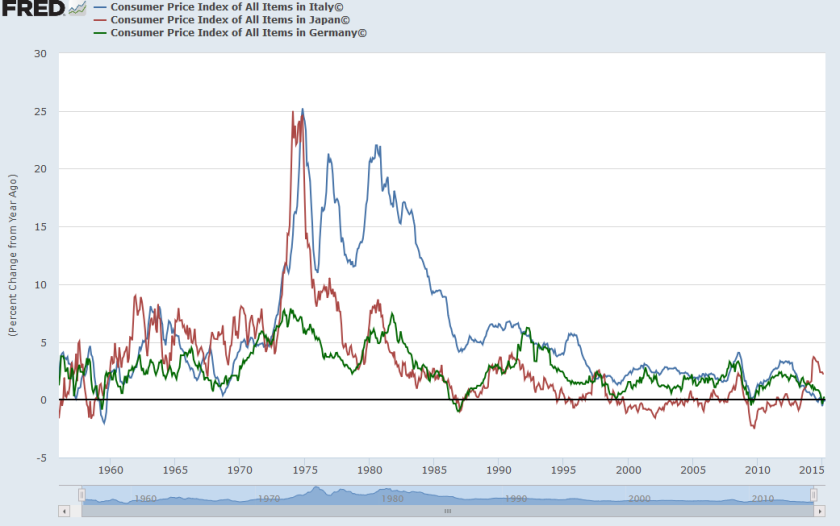
Screenshot (28)
http://research.stlouisfed.org/fred2/graph/?g=1EV9

Thus, in Italy, anything that happened before 2013 was an aggregate supply crisis with rough parallels to that in Indonesia in 1997-8, disguised by a single currency combined with relatively tight European Central Bank monetary policy, combined with increasing malinvestment resulting from flawed European integration both before and during the Eurozone depression, as is evident from its falling behind Germany in its RGDP/worker precisely when its currency became pegged to the Euro. Indeed, it is clear that in Italy, hourly compensation has risen faster than productivity since at least 2000.

Speaking of 1997, it’s pretty clear that Japan suffered mightily during the crash, which fairly few people discussing the Japanese stagnation in broad terms have seen fit to mention. Sometimes, Japan’s suffering in 1997 is blamed on the sales tax hike, but this is nonsense, as the 2014 sales tax hike, which was even greater, led to a much, much tinier crash in RGDP per worker. Unlike the German and Italian stagnations, which have been more or less continuous, the Japanese productivity stagnation has taken place in three discrete phases, all coinciding with financial crises: the post-bubble period of 1991-1993, while the Yen was strongly appreciating, the 1997 crisis and aftermath in 1997-1999, when the Yen strongly depreciated, and the deflationary period of the Great Recession, Q4 2008-Q1 2009, when the Yen strongly appreciated. It seems to me that the simplest explanation for Japan’s stagnation is that each great financial crisis Japan suffers through hits its high-productivity industries hardest, leading them to shed jobs and lead Japan’s average productivity to regress behind the U.S. Also, that Japan ended its natural productivity convergence with the U.S. in or around 1990. The natural pricing powers of the free market don’t bring productivity back to U.S. levels in a process of reconvergence due to notorious Japanese protectionism, which keeps the Japanese export-to-GDP ratio smaller than that of the U.K., Palestine, Australia, Mexico, Russia, or the Philippines.

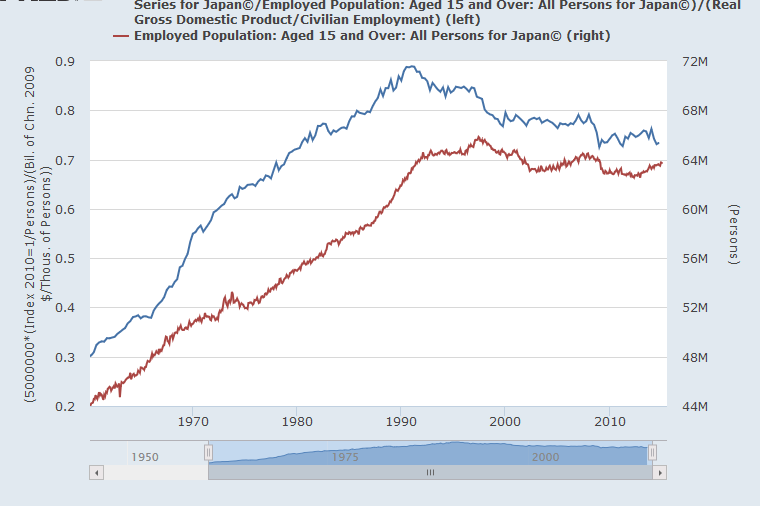
The famous correlations all too many people have in mind:
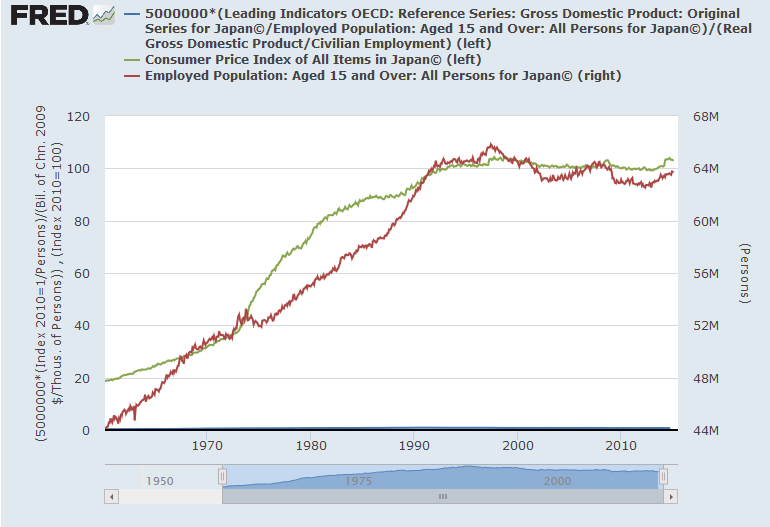
Screenshot (29)
Screenshot (30)
http://research.stlouisfed.org/fred2/graph/?g=1E1d

are little more than illusions. Japan’s productivity stagnation is not causally linked to its employment stagnation, and its CPI stagnation is not causally linked to its productivity stagnation. Had it had higher inflation, it would not have had higher growth. Had it had higher growth, it would not have had higher inflation. Had it had higher productivity growth, it would not (necessarily) have higher employment. Had it had higher employment growth, it would not (necessarily) have higher productivity.

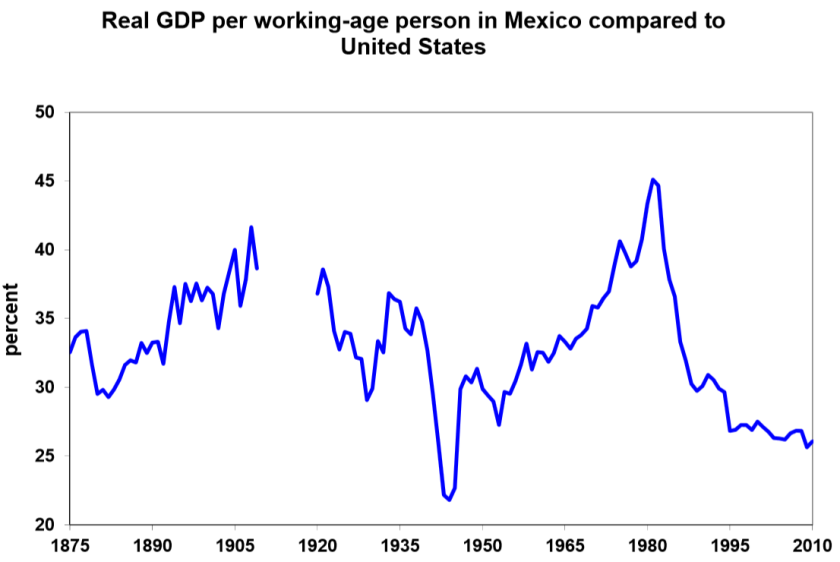
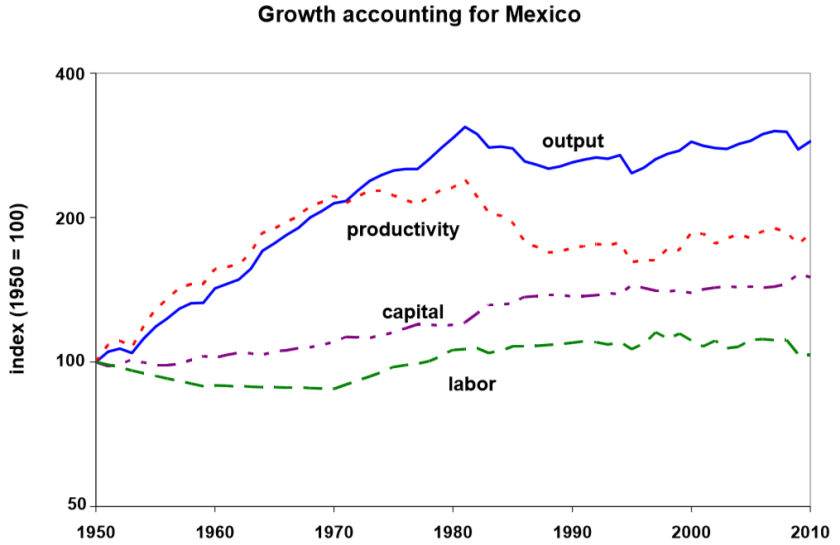
If it’s Japan’s population size which makes Japan’s stagnation such a disproportionate topic of discussion in the English-speaking world, then I know a country of 124 million people who’s productivity stagnation has been longer (by a decade) and much, much harder than that of Japan, and which is thousands of miles nearer to the U.S., and whose stagnation is much less discussed: Mexico:
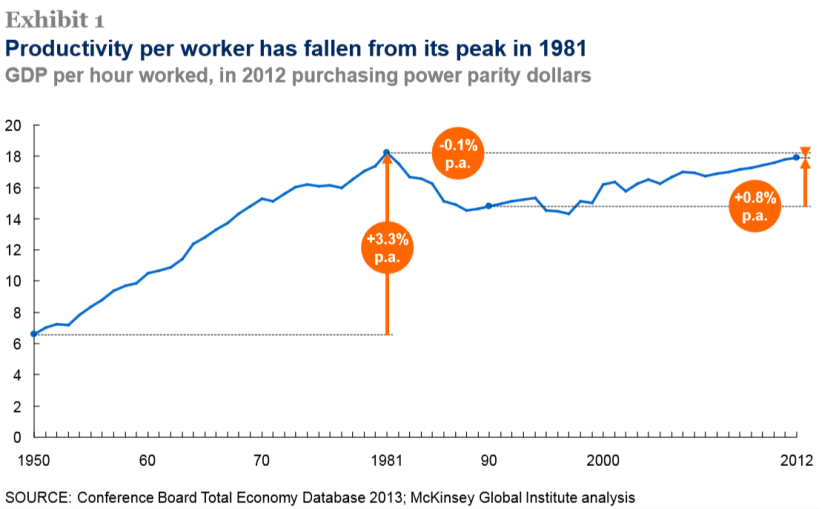
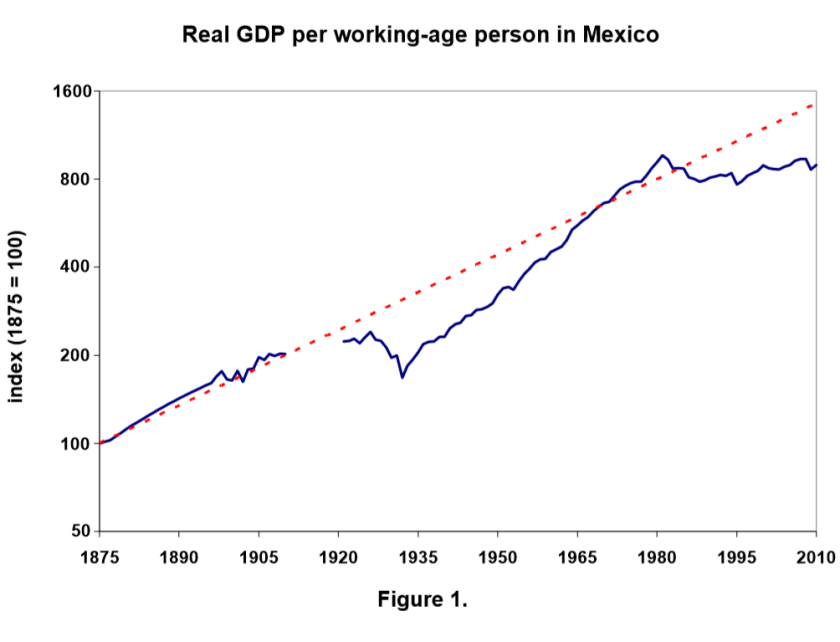
Screenshot (31)
Screenshot (32)
Screenshot (33)
Screenshot (34)
http://www.minneapolisfed.org/research/wp/wp69

Click to access MGI_Mexico_Full_report_March_2014.ashx3.pdf

But why does the former Sick Man of Europe and the present Healthy Man of Europe, Germany, have a similar history of GDP/worker rise and stagnation as Italy, only milder? From the data, it seems that Germany has been holding on to manufacturing jobs harder than the United States. My first thought was guessing working hours fell harder in Germany, but that turned out to be precisely the wrong explanation. The idea that Germany’s falling behind the U.S. in output per worker is due to different labor market fates in these countries is contradicted by a lot of the German productivity stagnation taking place before Germany’s labor market sclerosis began to subside in 2005. So my present guess is that Germany has been falling behind the United States due to its failure to move quickly from manufacturing into high-value-added services. Perhaps most of the Axis productivity stagnation can be explained via three factors: over-reliance on high-wage manufacturing, insufficient labor market churn, and an aging, more risk-averse working population.

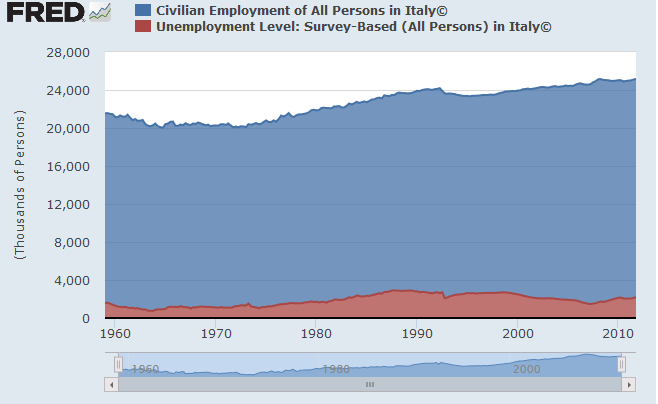
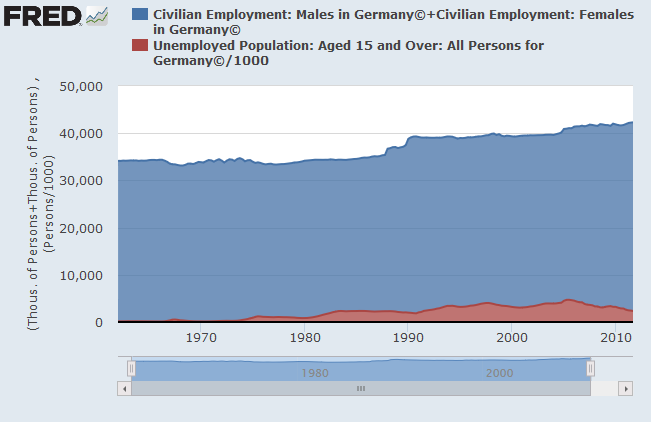
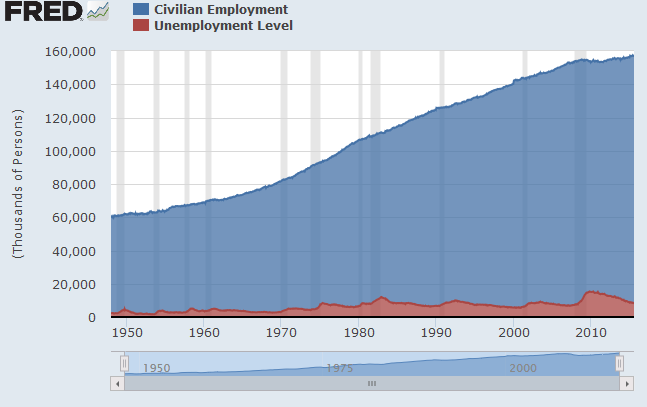
It now seems time to give some charts of the labor force sizes of the Axis countries, as well as that of the United States:

Screenshot (37)
http://research.stlouisfed.org/fred2/graph/?g=1Erx
Screenshot (38)
http://research.stlouisfed.org/fred2/graph/?g=1Ers
Screenshot (39)
http://research.stlouisfed.org/fred2/graph/?g=1Eu7
Screenshot (40)
http://research.stlouisfed.org/fred2/graph/?g=1FUm

Nothing here to clearly relate to productivity differences. Aw, well.

From these charts, it seems clear that variation in unemployment rates between countries really is mostly a structural issue, not one related to the rate of growth of the size of the labor force.

Development Successes; Development Failures

I recently wondered, after seeing Brazil and South Korea’s striking real GDP per capita divergence, which underdeveloped economies over the past forty years most succeeded and which most failed at growing their real GDP per capita. As Scott Sumner has pointed out, many countries (including, to some extent, the U.S.) experienced a permanent decline in real per capita GDP growth around the year 1973, though some countries (e.g., in Latin America) had high growth rates until the early 1980s Volcker Shock. North Korea, the Soviet Union, Singapore, South Africa, Japan, Greece, Portugal, Spain, Canada, and other nations that had managed to make great strides between 1900 and 1973 had dramatic growth slowdowns following that year, with Spain and Portugal having a decade of stagnation between 1974 and 1984 and Greece two such decades (1974-1994!). Italy, a country with lower living standards than China in 1900 and which had surpassed the U.K. in real GDP per capita (PPP) terms by 1976, had a growth slowdown around 1993 and another one around 2003. Japan had a very famous (and seemingly permanent) growth slowdown in 1991. Japan, France and Italy had all finished their phase of catch-up growth with the U.S. by 1973 (Germany had done so by 1961).

The below are the answers to the question mentioned in the first sentence of this post. All real GDP per capita numbers are from the World Bank. They can be verified by looking at Google Public Data.
Development Successes:

Former Soviet States:

Estonia (astonishing growth from 1994 to today) and the other Baltics

Belarus (astonishing growth from 1995 to 2011, especially compared with Ukraine, but economy has stagnated for the last two years)

Armenia and Georgia (grew at almost exactly the pace and level of China until 2009, but fell behind China as these countries had a recession in 2009, while China didn’t)

East Asian Successes:

China (so far; 21X increase in GDP per capita in 40 years counts as a success in any book, even if the economy stagnates for a century after)

The Four Asian Tigers (South Korea, Taiwan, Singapore, Hong Kong) and Macau

Slower-Growing East Asian Economies (successful for any other region, but not when compared to other Asian countries):

Vietnam (Grew 4X since reforms. Overly affected by China and seems like a complete failure compared to it).

Malaysia (GDP per capita 4.2X that of 1973).

Indonesia (GDP per capita 4.6X that of 1973. Seems like a failure compared to China).

Thailand (GDP per capita 5.3X that of 1973).

Latin American and Caribbean Successes:

Chile (2013 GDP per capita is 3.3X that at time of Pinochet’s coup).

Dominican Republic (2013 GDP per capita is 2.93X that in 1973).

St. Vincent and the Grenadines (2013 GDP per capita is 3.18X that in 1973).

Belize (2013 GDP per capita 2.96X that in 1973, but has stagnated for nearly a decade).

African Outliers:

Cabo Verde (2013 GDP per capita is 5.5X that in 1980)

Seychelles (2013 GDP per capita is 3.06X that in 1973).

Botswana (2013 GDP per capita is 6X that in 1973).

Lesotho (2013 GDP per capita is 2.93X that in 1973).

South Asian Successes:

Bhutan (miraculous growth since 1980 [GDP per capita 6.2X in 2013 compared with that of 1980] with no strong foundation of economic freedom, but, by all accounts, the best court system in South Asia).

India (2013 GDP per capita is 4.37X that in 1973).

Sri Lanka (2013 GDP per capita 4.66X that in 1973).

Mauritius (2013 GDP per capita 3.48X that in 1976).

Middle Eastern Successes:

Egypt (2013 GDP per capita 3.71X that in 1973).

Malta (2013 GDP per capita 3.68X that in 1973).

Celtic Tiger:

Ireland (2013 GDP per capita over 3.5X that in 1973).

Development Failures:

Asian Failures:

Philippines (Fell into a dump between 1982 and 2003. Very instructive East Asian failure, if only for showing East Asian economies can fail in an age of microchips.)

Papua New Guinea (18% GDP per capita growth in 40 years.)

Burma and North Korea (for obvious reasons)

Latin American Disasters:

Brazil (a country that pretended to be China between 1968 and 1980; 38% GDP per capita growth between 1980 and 2013)

Mexico (a country that hasn’t lost its track record of failure since 1980; GDP per capita in 2013 20% higher than that in 1980).

Nicaragua (1976 was the best year it’s ever had).

Suriname (yes, not Latin American, but still a failure from independence to the Year 2000)

Venezuela (the classic Latin American basket case; GDP per capita today lower than that in 1964).

Argentina (moving roughly sideways since at least 1960; GDP per capita in 2006 65% higher than that in 1960, but this may be due to understated inflation).

Haiti (same place it was in the 1950s).

Guatemala, El Salvador, Honduras (all in the same boat-failures growing at 0-2.5% per year)

African Countries:

South Africa (fell behind Brazil in growth terms after 1974)

Madagascar (steady decline; GDP per capita is 55% of what it was in 1960)

Senegal (GDP per capita remarkably steady; no change since 1960)

Togo (economic miracle until 1969; no lasting change in GDP per capita after that even unto this day).

Malawi (economic miracle between 1960 and 1979; no lasting change in GDP per capita after that even unto this day)

Comoros (GDP per capita is 20% lower than peak in 1984).

Guinea (amazingly flat)

Kenya (strong growth until 1972, stagnation for three decades, return to less impressive growth)

Niger (fantastic decline from 1966 onward followed by stagnation)

Gambia (stagnation since 1978)

Belgian Congo (it was 2.6X better off in real GDP per capita terms under Belgium).

Djibouti (country still not up to its 1990 level of real GDP per capita).

Burundi (5% growth per 53-year period)

Ivory Coast (strong growth until 1978; then, collapse until 2011)

Now, ask yourself: what was different between the failures and successes? Both some of the Latin American failures and the Asian tigers had industrial policies. Mexico has more economic freedom than China, but the labor force in Mexico is prematurely shifting away from the productive sectors (manufacturing and agriculture) and into the famously unproductive traditional economy and services, while China has successfully continued its rapid growth. What prevented the Comoros from growing like Taiwan, Singapore, or Egypt? Why is Belarus, well known for its red tape and financial repression, one of the development successes?

The Atomic Bomb Didn’t Have an Impact on Japan’s Decision to Surrender in WWII

To some, this might sound like utter foolishness. At least, it sounded that way to me when I first heard of the idea. However, in this article, Ward Wilson makes a remarkably convincing case that, as the Japanese leadership in 1945 cared remarkably little about the destruction of Japanese cities, the use of nuclear weapons by the U.S. in Japan had no impact on Japan’s decision to surrender. I’m amazed at how I could have been so wrong. The Soviet decision to declare war on Japan is usually barely discussed in U.S. High Schools, and is certainly not given precedence over the atomic bombing of Japan by the U.S.