It’s one thing to call for nuclear war against Turkey and the Turkish people (as I do). It is quite another to call for conventional war against the second-longest established nuclear power, as well as the only country with a nuclear stockpile even remotely close to the size and capability of that of the U.S.
Obviously, I cannot say the neocons are totally equivalent to neo-Nazis. The neocons are philosemitic (if not actually Semitic); the neo-Nazis are antisemitic. The neocons descend from Trotsky and his concept of world revolution; neo-Naziism descends from German racialism and militarism, as well as from local racial tensions. The neocons promote dildocracy; the neo-Nazis are generally against it. But in at least one instance, they are peas in a pod.
The national government deficit is 14% of GDP. Inflation is 14%. The rate of Real GDP growth is 0%. What is the national debt-GDP ratio doing?*
The national government deficit is 5% of GDP. Inflation is 2%. The rate of Real GDP growth is 1% per year. What is the national debt-GDP ratio doing?**
*Staying flat.
**Increasing by 2 percentage points per year.
This is why looking at the national debt-GDP ratios of the US and UK in the 1970s and 1980s and making conclusions about fiscal conservatism is hopelessly misleading. Doubly so, in fact, due to the close relationship between unemployment and the national government deficit combined with the Phillips Curve. Complaining about “soaring deficits” in the 1980s due to the “soaring” debt-GDP ratios may be outright lying.
Unlike Coates’ earlier major Atlantic piece, The Case for Reparations, which was trite and totally unnecessary for me to have read, I found this latest piece of Coates fairly awesome. In it, he makes a stirring case for the expansion of the prison state, explaining why the vast majority of those incarcerated today basically deserve it, why Daniel Patrick Moynihan was right about everything except opposing mass incarceration, and why reparations for slavery won’t fix anything -while probably not intending to! Were the good Steve Sailer to have written it, except for some sentences and concluding sections, and, of course, the broader tone and use of examples, the piece would be largely intact.
Choice quotes (all filled with awesome!):
As the civil-rights movement wound down, Moynihan looked out and saw a black population reeling under the effects of 350 years of bondage and plunder. He believed that these effects could be addressed through state action. They were—through the mass incarceration of millions of black people.
In 1984, 70 percent of all parolees successfully completed their term without arrest and were granted full freedom. In 1996, only 44 percent did. As of 2013, 33 percent do.
The carceral state has, in effect, become a credentialing institution as significant as the military, public schools, or universities—but the credentialing that prison or jail offers is negative.
Deindustrialization had presented an employment problem for America’s poor and working class of all races.
“Roughly half of today’s prison inmates are functionally illiterate,”
Kelly Miller, who was then a leading black intellectual and a professor at Howard University, presaged the call for blacks to be “twice as good,” asserting in 1899 that it was not enough for “ninety-five out of every hundred Negroes” to be lawful. “The ninety-five must band themselves together to restrain or suppress the vicious five.”
So even as violent crime declined between 1925 and 1940, Louisiana’s incarceration rate increased by more than 50 percent.
The cure, as Nixon saw it, was not addressing criminogenic conditions, but locking up more people. “Doubling the conviction rate in this country would do far more to cure crime in America than quadrupling the funds for [the] War on Poverty,” he said in 1968.
The justification for resorting to incarceration was the same in 1996 as it was in 1896.
The argument that high crime is the predictable result of a series of oppressive racist policies does not render the victims of those policies bulletproof.
In prison, Odell has repeatedly attempted to gain his G.E.D., failing the test several times. “My previous grade school teacher noted that I should be placed in special education,” Odell wrote in a 2014 letter to his lawyer. “It is unclear what roll childhood lead poisoning played in my analytical capabilities.”
In 2006, Martin O’Malley (who’s currently vying to be the Democrats’ nominee for president in 2016) defeated Ehrlich to become governor, but he took an even stricter stance on lifers than his predecessor, failing to act on even a single recommendation of the Parole Commission.
One of my great irritants is how so much of our discussions on race and racism proceed from the notion that American history begins in the 1960s. The discussions around Detroit is the obvious example. There is a popular narrative which holds that Detroit was a glorious city and the riots ruined it. Thomas J. Sugrue’s The Origins Of the Urban Crisis does a great job at dialing back this idea and pointing to the long arc of the city’s decline.
The fires of 1967 conveniently obscured those perils. But the structural problems, along with the wave of deindustrialization, were what gifted America with the modern “Negro problem.” By the 1970s, the government institution charged with mediating these problems was, in the main, the criminal-justice system.
“African Americans in our data are distinct from both Latinos and whites,” Robert Sampson told me. “Even when we control for marital status and family history of criminality, we still see these strong differences. The compounded deprivation that African Americans experience is a challenge even independent of all the characteristics we think are protective.”
Moynihan’s observation about the insufficiency of civil-rights legislation has been proved largely correct.
“The Negro Family” is a flawed work in part because it is a fundamentally sexist document that promotes the importance not just of family but of patriarchy, arguing that black men should be empowered at the expense of black women.
“It would be difficult to overestimate the degree to which young well educated blacks detest white America.”
Moynihan ominously cited a “rather pronounced revival—in impeccably respectable circles—of the proposition that there is a difference in genetic potential” between the two races.
Crime really did begin to rise during the early 1970s. But by this point, Moynihan had changed. According to the Moynihan of the Nixon era, middle-class blacks were not hardworking Americans attempting to get ahead—they were mobsters demanding protection money in exchange for the safety of America’s cities. And the “unusually self-damaging” black poor were hapless tools, the knife at the throat of blameless white America.
One does not build a safety net for a race of predators. One builds a cage.
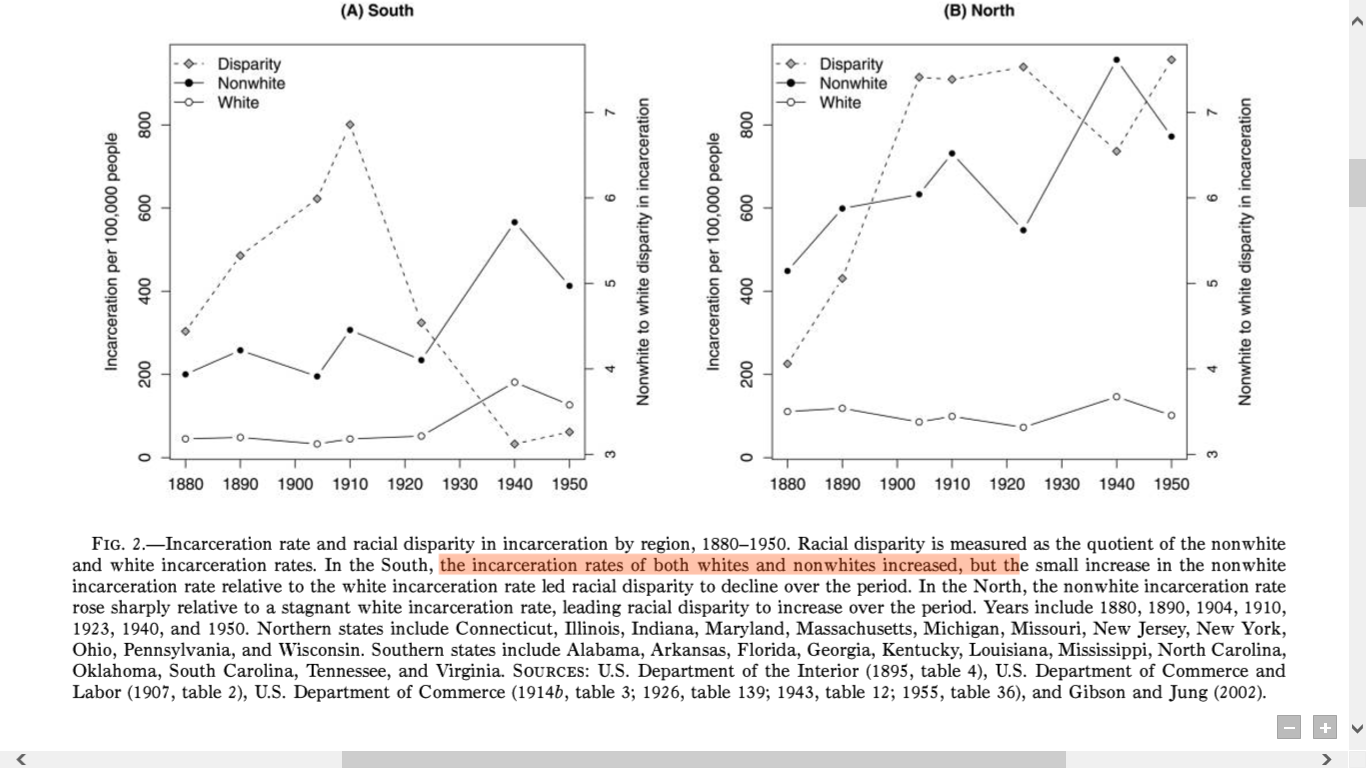
In 1900, the black-white incarceration disparity in the North was seven to one —roughly the same disparity that exists today on a national scale.
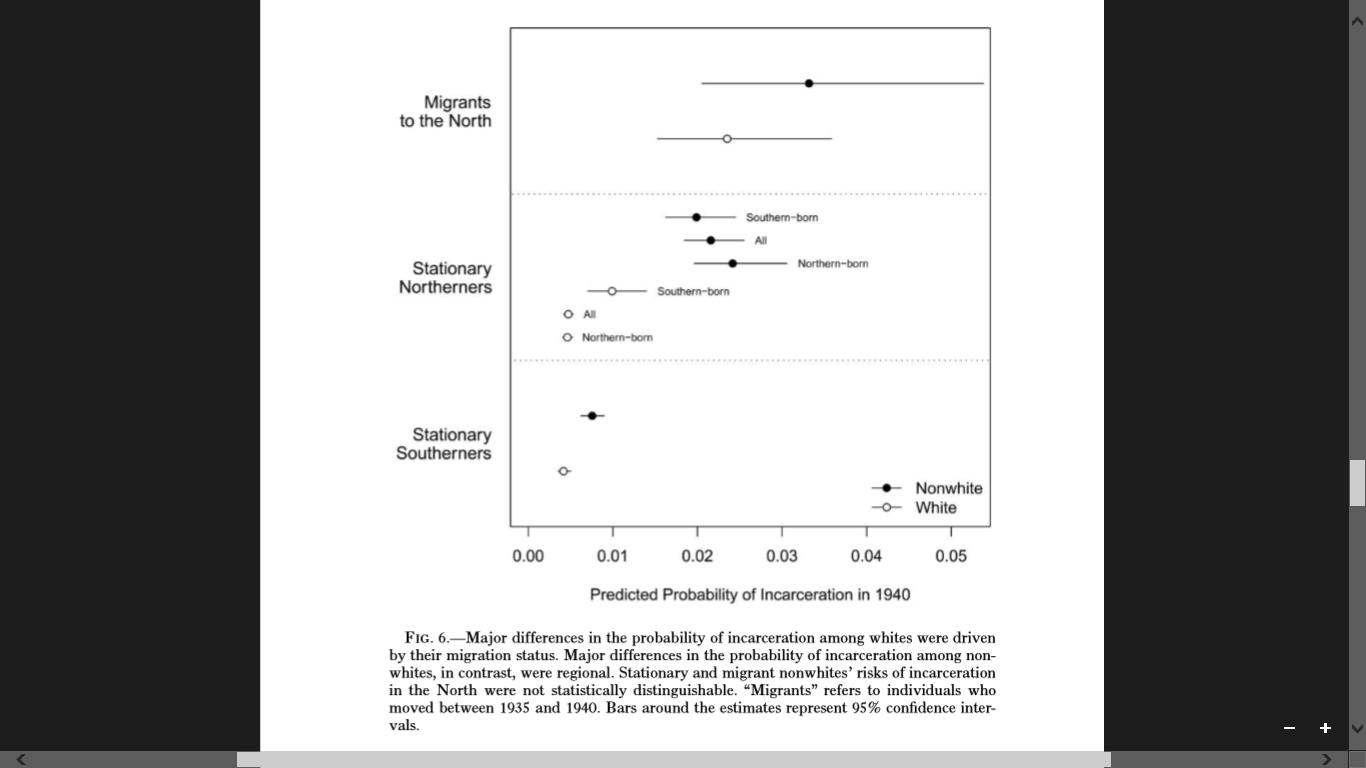
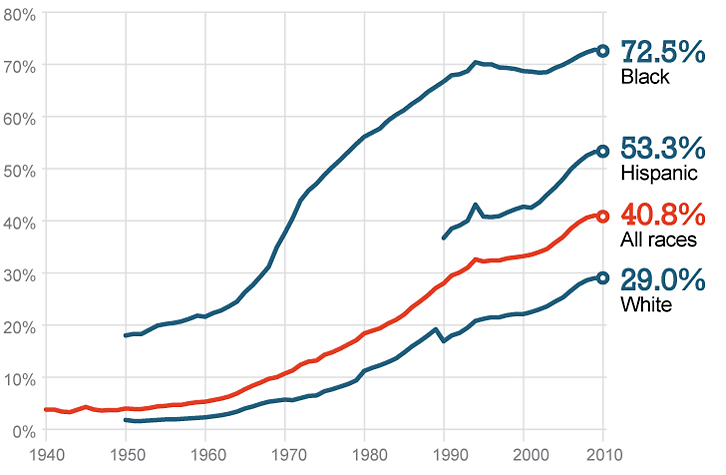
This statement links to a really interesting article, of which the choice graphs are these:
In 1972, the U.S. incarceration rate was 161 per 100,000—slightly higher than the English and Welsh incarceration rate today (148 per 100,000). To return to that 1972 level, America would have to cut its prison and jail population by some 80 percent. The popular notion that this can largely be accomplished by releasing nonviolent drug offenders is false—as of 2012, 54 percent of all inmates in state prisons had been sentenced for violent offenses.
One 2004 study found that the proportion of “unambiguously low-level drug offenders” could be less than 6 percent in state prisons and less than 2 percent in federal ones.
There is no reason to assume that a smaller correctional system inevitably means a more equitable correctional system. Examining Minnesota’s system, Richard S. Frase, a professor of criminal law at the University of Minnesota, found a state whose relatively sane justice policies give it one of the lowest incarceration rates in the country—and yet whose economic disparities give it one of the worst black-white incarceration ratios in the country.
And so it is not possible to truly reform our justice system without reforming the institutional structures, the communities, and the politics that surround it.
And should crime rates rise again, there is no reason to believe that black people, black communities, black families will not be fed into the great maw again.
The graphs are also informative, and help illustrate Coates’ case, as I’ve put it, well.
There are obviously problematic parts to Coates’ piece -he’s still considers “an autocratic Vladimir Putin” to be the same as Russia’s entire criminal justice system (which is obviously much worse than America’s). Believe me, Russia’s criminal justice system was bad before Putin, is bad today, and will continue to be bad after Putin. Coates’ use of international comparisons is likely specious. According to Coates, Canada’s incarceration rate never strongly changed from 1960 to today. The statistics seem to back him up on this fact.
Meanwhile, Canada’s homicide rate did not decline as much as in the U.S. during the 1990s and 2000s, while it stayed stable during the 1980s, as in the U.S. Canada offers a useful test case for lack of mass incarceration, leading me to take the claim that increased incarceration is of only minimal importance in explaining the rise and fall of North American crime much more seriously, but it hardly refutes the general point that incarceration reduces crime by taking criminals off the streets.
But perhaps the worst part of it is this ludicrous piece of bullshit:
“There’s very little evidence that it brought down crime—and abundant evidence that it hindered employment for black men, and accelerated the kind of family breakdown that Clinton and Moynihan both lamented.”
-Never mind the dubious claim (which I have not yet researched in depth) that there’s very little evidence mass incarceration brought down crime- Coates cites zero evidence that it has in any way affected “the kind of family breakdown that Clinton and Moynihan both lamented”, much less accelerated it. Most of the collapse of the American Black family took place before American mass incarceration. Most of the collapse of the American White family took place after its beginning. The correct comparison is not between incarcerated men and non-incarcerated men, but incarcerated and non-incarcerated men of similar age and criminal background. In fact, it was during the period 1982-1988 (you have to choose your years wisely here; the 1980-1982 recessions hurt Blacks far more than Whites) that the Black and White male employment/non-incarcerated-population ratios converged most strongly. The most reasonable explanation for the collapse of the Black (and later White) family is contraception and abortion. Yeah, I know, the Catholic Church is right on this one, as is Roissy!
There are, of course, other errors:
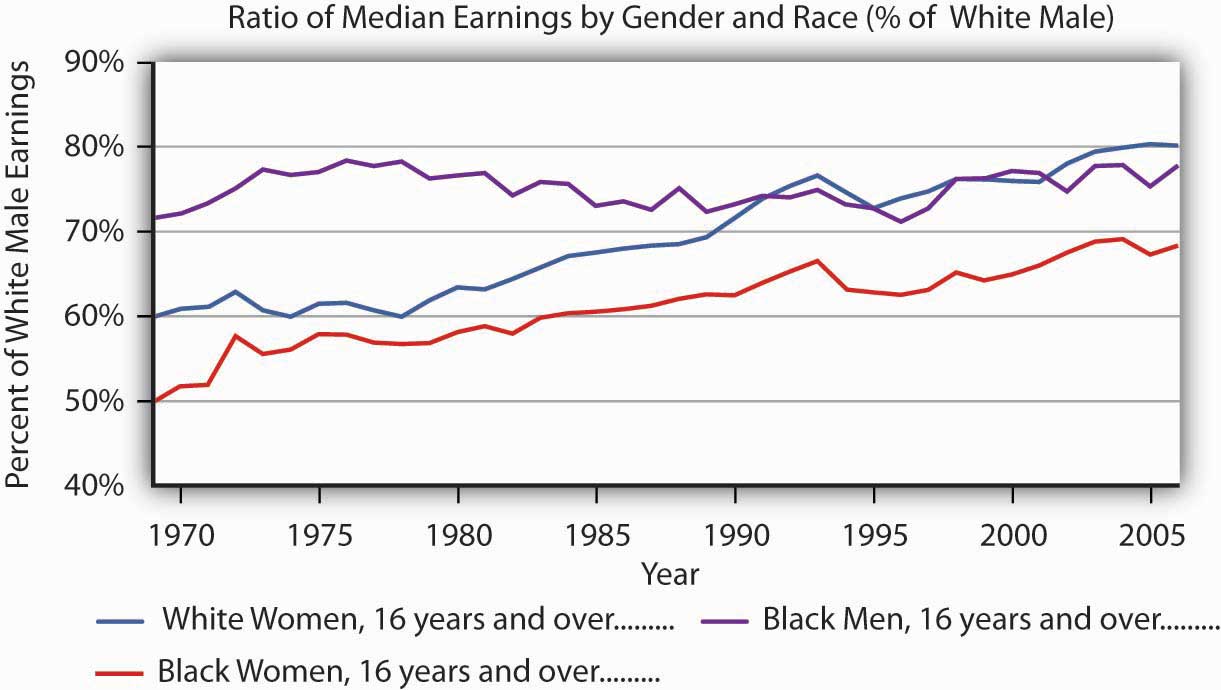
“Even in the booming ’90s, when nearly every American demographic group improved its economic position, black men were left out.”
-The common opinion at the time was pleasure that black men (at least, the non-incarcerated ones) weren’t left out during the 1990s. And, indeed, they weren’t:
From 2012books.lardbucket.org/books/microeconomics-principles-v1.0/section_22/09d7330a38081520dc990b7d48d86982.jpg
The claim that “This might well have been true as a description of drug enforcement policies, but it was not true of actual drug abuse: Surveys have repeatedly shown that blacks and whites use drugs at remarkably comparable rates.” is also ridiculous, as anyone who has any basic intuition knows. “Surveys” are unreliable (i.e., they lead to wrong results) and misleading (they ignore the length and pattern of drug use). See the link above in this paragraph!
The claim of “persistent racism” in Detroit (an 80+%-Black city!) and in the rest of America is utter crap, but fairly ignorable tripe. If anything, the problem in Detroit is “persistent racism” against Whites, which has, quite fortunately, been alleviated to some extent in the past few years. Referencing “Jim Crow” in the context of Detroit is also nonsensical, as Jim Crow never existed there. Blaming mass incarceration for “ensuring that the peril continues” is also nuts. Mass incarceration is a response to peril; it is not a net contributor to it. Incarceration, as Coates has already pointed out, is a signalling mechanism. And there’s nothing wrong with reducing the noise-signal ratio. Bruce Western’s claims are total nonsense. If Blacks were Chinese (or at least Vietnamese), they wouldn’t be disproportionately incarcerated. The idea wages for Black men have remained stagnant “largely due to our correctional policy” is the opposite of the truth, as basic supply-and-demand would easily illustrate. A scarcity of labor results in an increase in wages, not a decrease, as the Medieval Plague showed.
Indeed, the vast majority of U.S. Blacks do not see themselves as treated unfairly by the police, and this variable remains near an all-time high:
Look at all the racism!
Combined with Ryan Faulk’s new and true demonstration that Black-White school funding differences in the Jim Crow South had, if anything, a slight equalizing impact on the present-day Black-White school test score gap, Coates’ piece powerfully shows that the end of Jim Crow really didn’t change much for the vast majority of anyone except those Black Americans in the right-most third of the Black American IQ bell curve. Indeed, Black optimism regarding the future of Black-White relations peaked during the Civil Rights era and fell behind that of Whites during the 1990s:
This suggests two things:
1. Obstacles to Black advancement are few.
2. There’s most likely never going to be a solution to Black-White relations in America. Not in five years, not in fifty years, and probably not in five hundred years.
Jim Crow is dead. Equal treatment (and, occasionally, preferential treatment in favor of Blacks) is the law. Convergence is nowhere in sight.
There is no evidence Blacks can build first-world countries when not under White supervision.* There is no evidence of any consistent trend of convergence between White and Black American social outcomes since a generation ago. There is no evidence anything outside eugenics can change that**. Reparations are a farce. Systemic change is a farce. Ending mass incarceration is a danger (see quotes on the composition of the prison population above).
*The Bahamas, the only Black-majority first-world country, became independent in 1973 and had a higher Real GDP per capita in 1969 than today.
**Yes, moving to opportunity had some success in improving individual poor Black social outcomes, probably due mostly to the effects of the beneficiaries getting a better preparation for High School and a Bachelor’s Degree. But even if the fallacy of composition does not apply in this case (a highly dubious assumption), and education is not largely a pure signaling competition (also a highly dubious assumption), a one-time level change a consistent trend of convergence does not make.
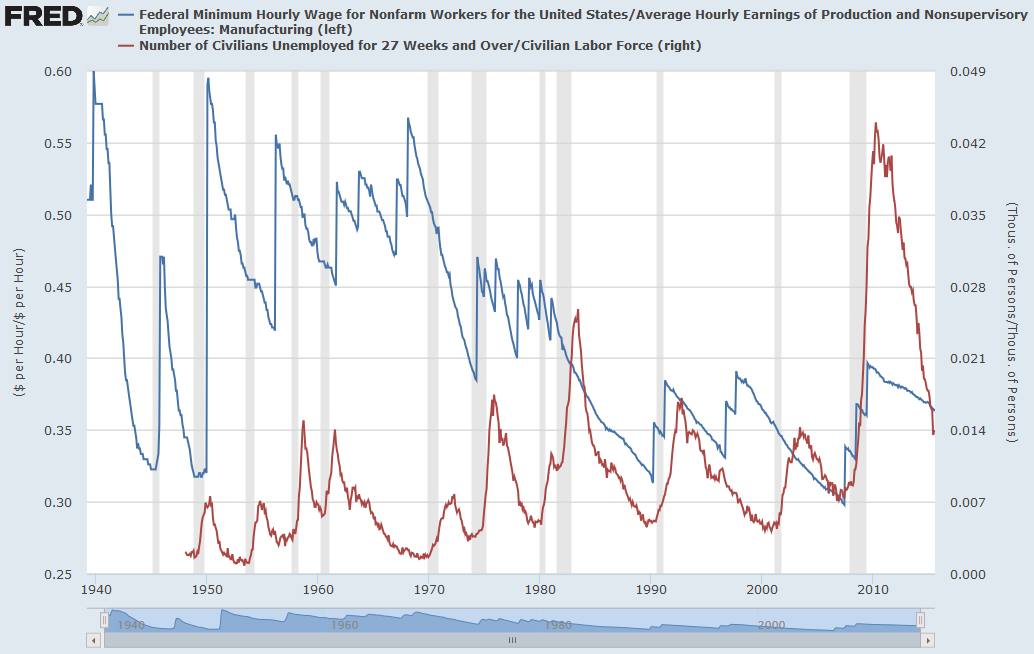
Answer: pretty high (at least $12), but see below for qualifications and doubts. The highest Federal minimum wage in U.S. history, relative to the average manufacturing wage, was the modern-day equivalent of $12. It took effect in October 1939. However, this only applied to employees engaged in interstate commerce or the production of goods for interstate commerce, so it isn’t clear what percentage of the U.S. workforce was affected by it: https://research.stlouisfed.org/fred2/graph/?g=1LZX
Note: to convert minimum wage from portion of prevailing average manufacturing wage into approximate present dollar equivalent, multiply the portion by twenty or twenty-one.
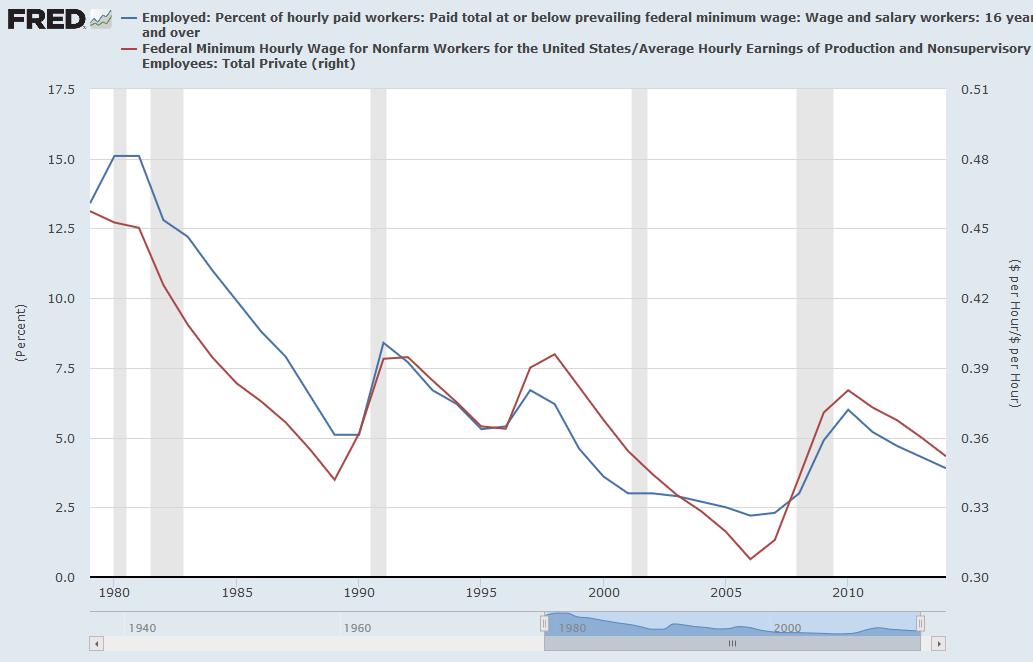
However, assuming this correlation: https://research.stlouisfed.org/fred2/graph/?g=1M09
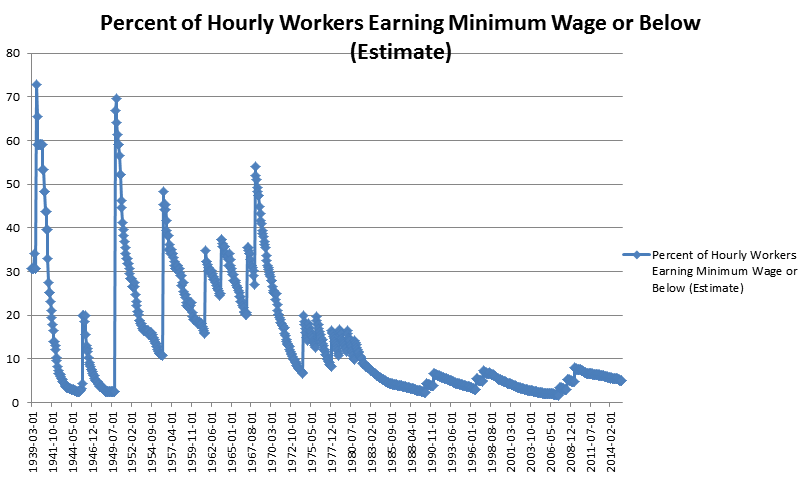
(R² = 0.83841884602996, using a power trendline) was sound for the time, this is what the portion of hourly paid wage and salary workers working at or below the highest Federal minimum wage would have looked like before 1978, if the power trendline correlation used for the average hourly wage in the U.S. is applied to the average hourly manufacturing wage (not quite the same thing, especially after 2006):
I strongly doubt that over 50% of hourly workers in 1969 or over 65% in 1950 had their pay determined by the maximum hourly Federal minimum wage of the time. How many workers actually had their pay determined by the various minimum wages of the time would be interesting to see. Also, it’s not just the Federal minimum wage that matters -state and local minimum wages matter just as much, perhaps, even more.
In the old days, the highest U.S. minimum wage was more restricted in application than it is today, yet, far higher relative to prevailing average wages. The minimum wage only became fully unified for farm and nonfarm workers in 1978, when farm work had become all but irrelevant in America. However, it is clear that the minimum wage has generally had little effect on broad unemployment trends in the United States: the modern era of high over-27 week unemployment began only in 1974: precisely when the minimum wage relative to the prevailing average wage came down from its secular heights in the 1950s and 1960s. Also, note that the largest minimum wage increase in post-WW II U.S. history; that in January 1950, seemed to have no substantial effect on the natural rate of unemployment (it also coincided with, but certainly did not cause, the largest RGDP/worker boom in post-WWII U.S. history).
There were four periods in U.S. history when minimum wage hikes occurred around recessions: the minimum wage hikes around the recession of 1990, which pushed the percentage of hourly paid wage and salary workers paid at or below the minimum wage up to 1986 levels, the minimum wage hikes around the Great Recession, which pushed the percentage of hourly paid wage and salary workers paid at or below the minimum wage up to 1998 levels, and the minimum wage hikes of 1945 and 1974.
Thus, I doubt the Federal minimum wage is very important in explaining broad unemployment trends from 1939 to today. But this is hardly an exhaustive study on this topic, and does not look at the actual prevalence of the various state, Federal, and local minimum wages for the various occupations to which it applied from 1939 to today. Such a study would be very useful in explaining how high a minimum wage would cause an appreciable amount of unemployment, especially for low-skilled workers.
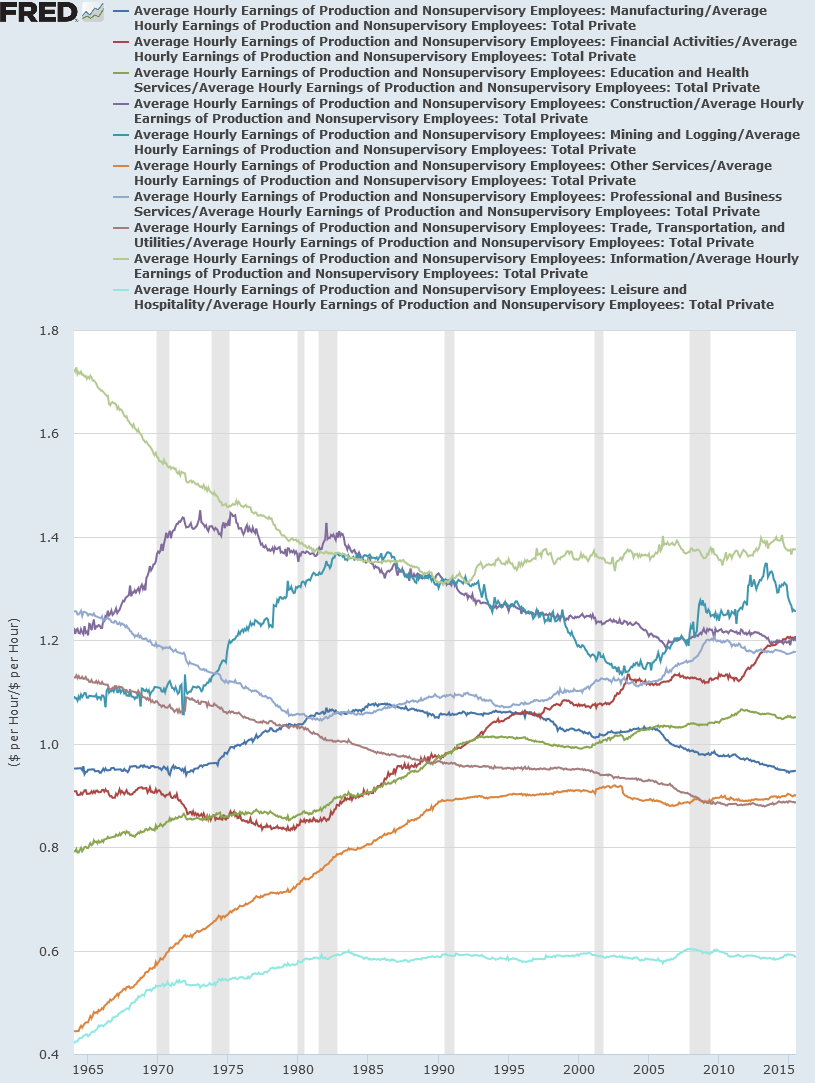
By the way, also see this post for the Federal minimum wage growing faster than productivity for most workers who are actually paid the minimum wage or below, and why the Far Left is generally deceptive in its claims about the minimum wage and productivity. Also, I have noticed a small upward trend with average wages for leisure and hospitality workers in the late 1960s which I’m fairly, but not quite, sure has nothing to do with the expansion of the applicability of the Federal minimum wage:
Of course, I completely oppose the minimum wage, as well as any other price control during peacetime. The minimum wage, despite its seemingly small effect on U.S. unemployment, is never a good thing on net, as it interferes with the proper functioning of the free market and is fundamentally against Americans’ freedom without any clear net social benefit. The full long-term effects of price controls and their interactions with markets are more difficult to predict than most think.
Update #2: The minimum wage hike of 1950 (largest of all time) was intended for all workers covered by the fair labor standards act; roughly half of wage and salary workers. So probably something like 30% of wage and salary workers had their pay directly determined by the Federal minimum wage at the time-higher than the level in the 1970s, but nowhere near 70%.
Looking at the previous post on the country, a question arises: if North Korea was, in some respects, ahead of the South in the early 1970s, to the extent that, in 1970, the Black Panthers could look on it as a model of resistance, and Joan Robinson could speak of a (North) “Korean Miracle” in 1964, when, exactly, did it start to fall behind?
According to the paper Assessing the economic performance of North Korea, 1954–1989: Estimates and growth accounting analysis., there was only one period in which North Korean per capita real GNP grew faster than South Korea’s: the period 1954-1960. From then on, North Korea, with the exception of the period 1980-1985, consistently had a per capita real GNP growth rate of below 3%, growing an average 1.9% per year from 1954 to 1989. This (except for the early 1980s boom claim) is consistent with the per capita electricity consumption figures, which show that while North Korean per capita electricity consumption from 1971 to 1989 grew at at a thoroughly unimpressive 2.14% per year, South Korean per capita electricity consumption grew at a stunning 11.5% per year during the same period. The energy consumption statistics are more consistent with the early 1980s boom claim. Interestingly, up until the 1990s, North Korean per capita electricity consumption was no different from Argentina’s, suggesting North Korea had a truly abysmal capital productivity, as Argentina had a per capita GDP (PPP) at least three times as high as that of North Korea. The North Korean country study seems to be consistent with the surprisingly early slowdown, describing the post-war three-year-plan and five-year plan of the 1950s as successes and the North Korean economic slowdown as beginning in the “buffer year” of 1960. On the other hand, the semi-socialistic outward-oriented South Korean economy boomed after the 1961 coup. Apparently, the South’s economic surpassing of the North in the 1960s is evident even from the statistics on the sectoral composition of the labor force.
However, from the 1950s to the 1970s, housing construction boomed while the rest of the economy slowed. Yet, even housing construction must have declined during the late 1970s, as there was a sharp slowdown in North Korean urbanization at the time.
So when Brad DeLong says he, too, thought Joan Robinson’s support for “absorbing the South into socialism” in 1977 was “loony”, we now know why.
The question remains why the North fell behind the South economically so early in the 1960s and continued doing so during the 1970s and 1980s, and why the North is so much poorer than even neighboring China. This is a question which must be explored in a later post.
Note: Pretty much all this post was written on April 12, 2015. Only the first link and this and the above paragraph have been added, as well as the note on the energy consumption statistics. It is only being published today due to A. Karlin’s response to R. Khan‘s brief post on Communism.
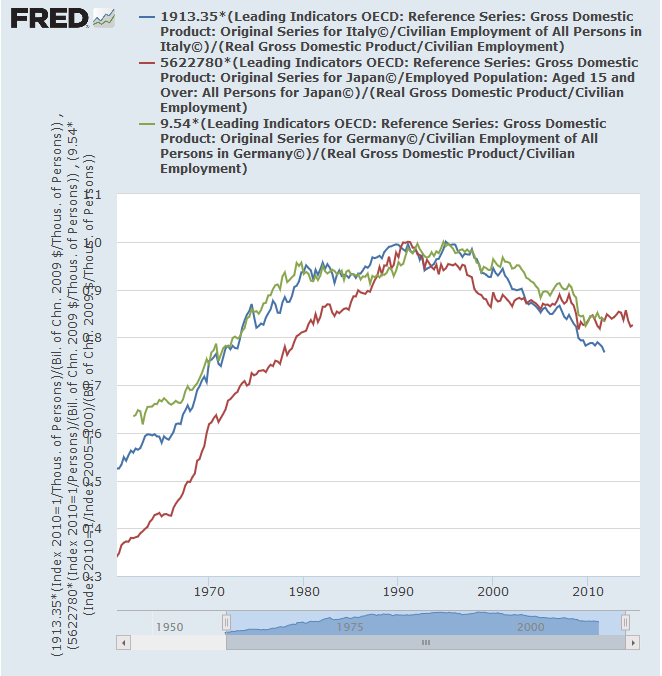
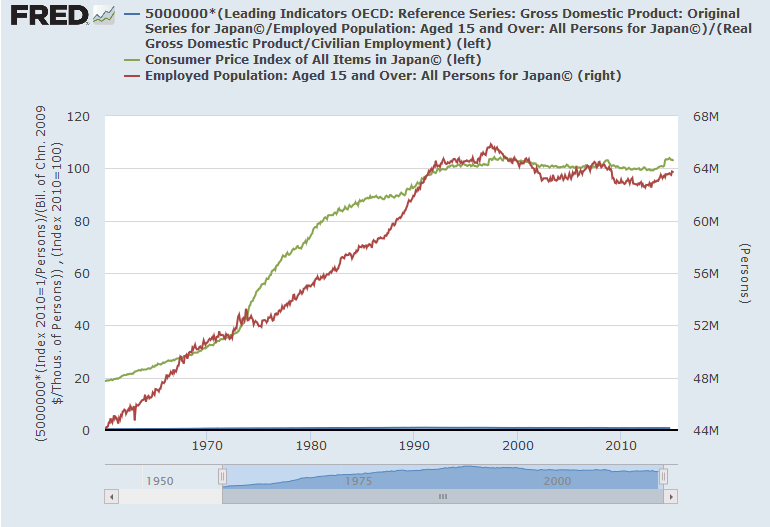
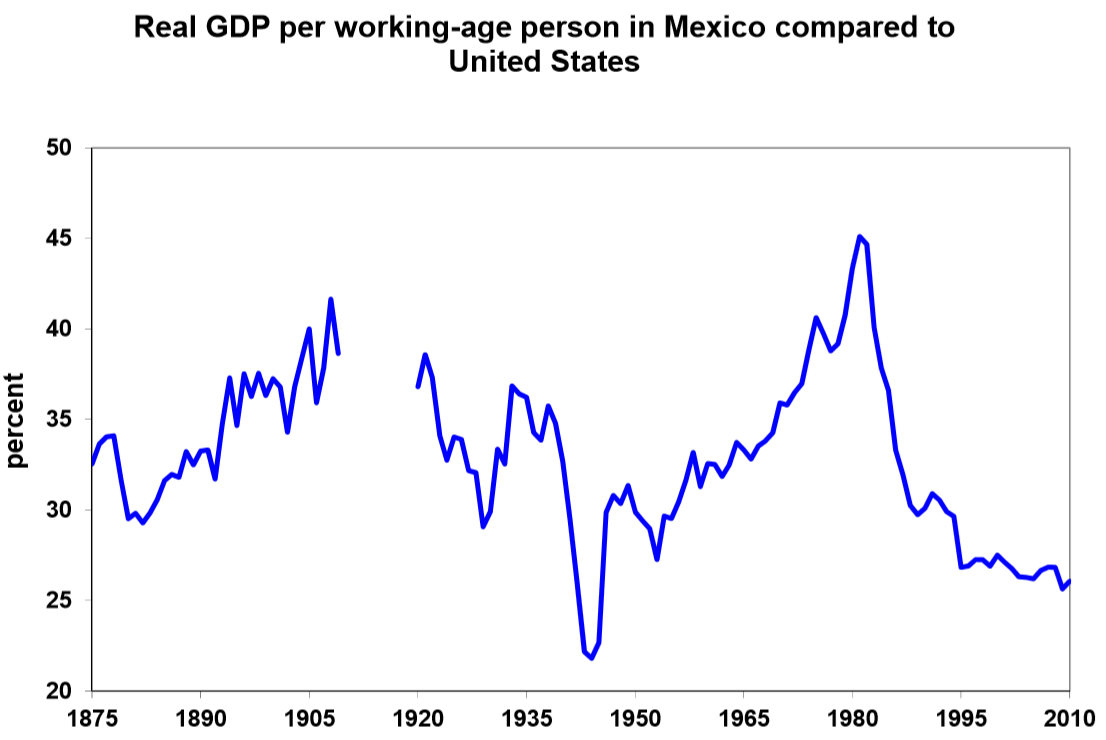
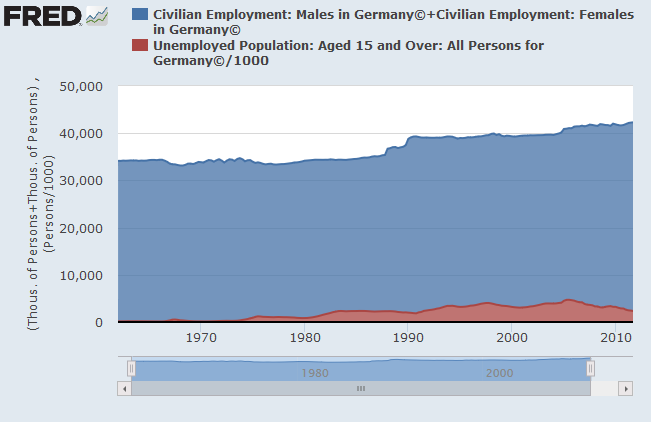
The post-1990 stagnation in Japan has been much discussed, analyzed, and ballyhooed. Yet, comparatively little attention has been given to the other Axis powers, Germany and Italy, which are nearly equally stagnant (Italy more so, Germany slightly less). The reason is that Japan’s stagnation started earlier and then decelerated, while Germany’s and Italy’s started and accelerated later. Let us look at the RGDP/worker of these countries in relation to that in the United States (peak=1):
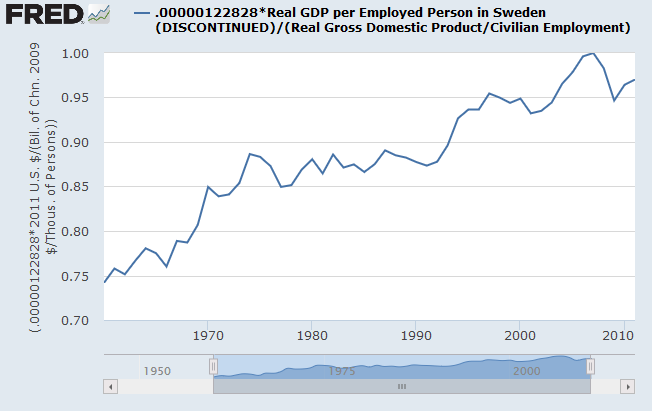
Compare this to the same variable in, for example, Sweden: http://research.stlouisfed.org/fred2/graph/?g=1EMr
Basically, Sweden has little more than an exaggerated version of the U.S. trend. So what is going on in the Axis countries?
Whatever it is, it probably has nothing whatsoever to do with aggregate demand, and probably has to do with anything financial only on a tangential level. Since 1995, the highest rate of inflation among the Axis countries has been in Italy, yet it has had the worst stagnation. By simply glancing at inflation, it is clear that Italy only began to suffer unique aggregate demand problems in April 2013-precisely when Italy’s output per worker bottomed out! Also, as pointed out by Mark Sadowski, a huge (and successful) aggregate demand stimulus effort carried out by the Bank of Japan in 2012-2015 failed to significantly boost the rate of real GDP growth, while it did successfully boost the rate of nominal GDP growth.
Thus, in Italy, anything that happened before 2013 was an aggregate supply crisis with rough parallels to that in Indonesia in 1997-8, disguised by a single currency combined with relatively tight European Central Bank monetary policy, combined with increasing malinvestment resulting from flawed European integration both before and during the Eurozone depression, as is evident from its falling behind Germany in its RGDP/worker precisely when its currency became pegged to the Euro. Indeed, it is clear that in Italy, hourly compensation has risen faster than productivity since at least 2000.
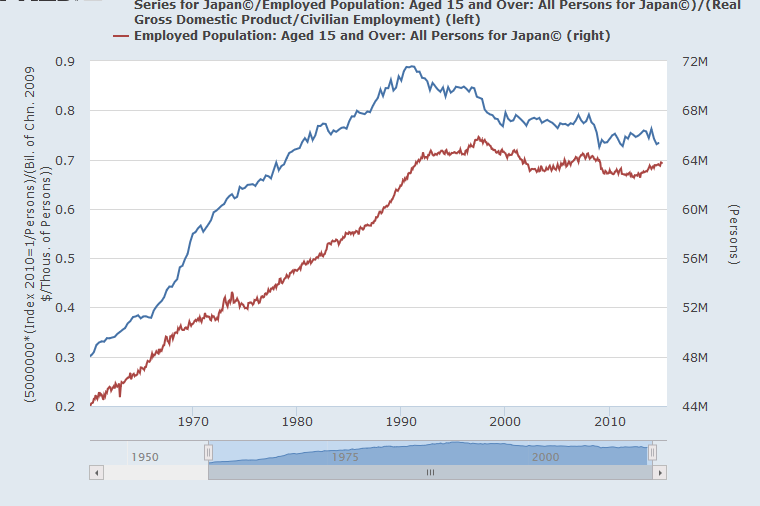
Speaking of 1997, it’s pretty clear that Japan suffered mightily during the crash, which fairly few people discussing the Japanese stagnation in broad terms have seen fit to mention. Sometimes, Japan’s suffering in 1997 is blamed on the sales tax hike, but this is nonsense, as the 2014 sales tax hike, which was even greater, led to a much, much tinier crash in RGDP per worker. Unlike the German and Italian stagnations, which have been more or less continuous, the Japanese productivity stagnation has taken place in three discrete phases, all coinciding with financial crises: the post-bubble period of 1991-1993, while the Yen was strongly appreciating, the 1997 crisis and aftermath in 1997-1999, when the Yen strongly depreciated, and the deflationary period of the Great Recession, Q4 2008-Q1 2009, when the Yen strongly appreciated. It seems to me that the simplest explanation for Japan’s stagnation is that each great financial crisis Japan suffers through hits its high-productivity industries hardest, leading them to shed jobs and lead Japan’s average productivity to regress behind the U.S. Also, that Japan ended its natural productivity convergence with the U.S. in or around 1990. The natural pricing powers of the free market don’t bring productivity back to U.S. levels in a process of reconvergence due to notorious Japanese protectionism, which keeps the Japanese export-to-GDP ratio smaller than that of the U.K., Palestine, Australia, Mexico, Russia, or the Philippines.
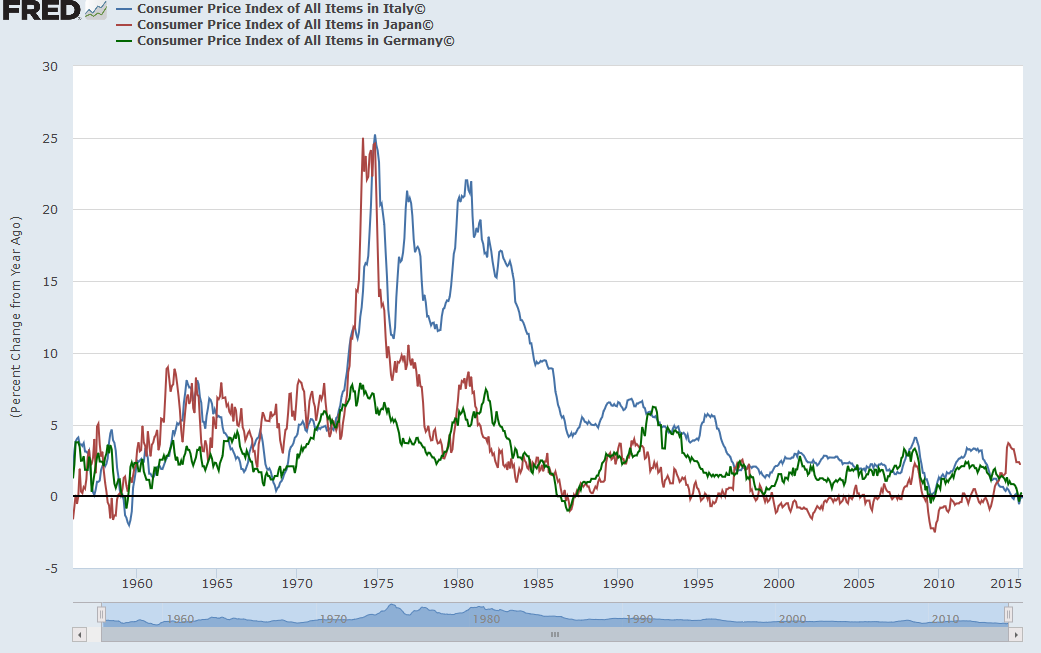
The famous correlations all too many people have in mind:
are little more than illusions. Japan’s productivity stagnation is not causally linked to its employment stagnation, and its CPI stagnation is not causally linked to its productivity stagnation. Had it had higher inflation, it would not have had higher growth. Had it had higher growth, it would not have had higher inflation. Had it had higher productivity growth, it would not (necessarily) have higher employment. Had it had higher employment growth, it would not (necessarily) have higher productivity.
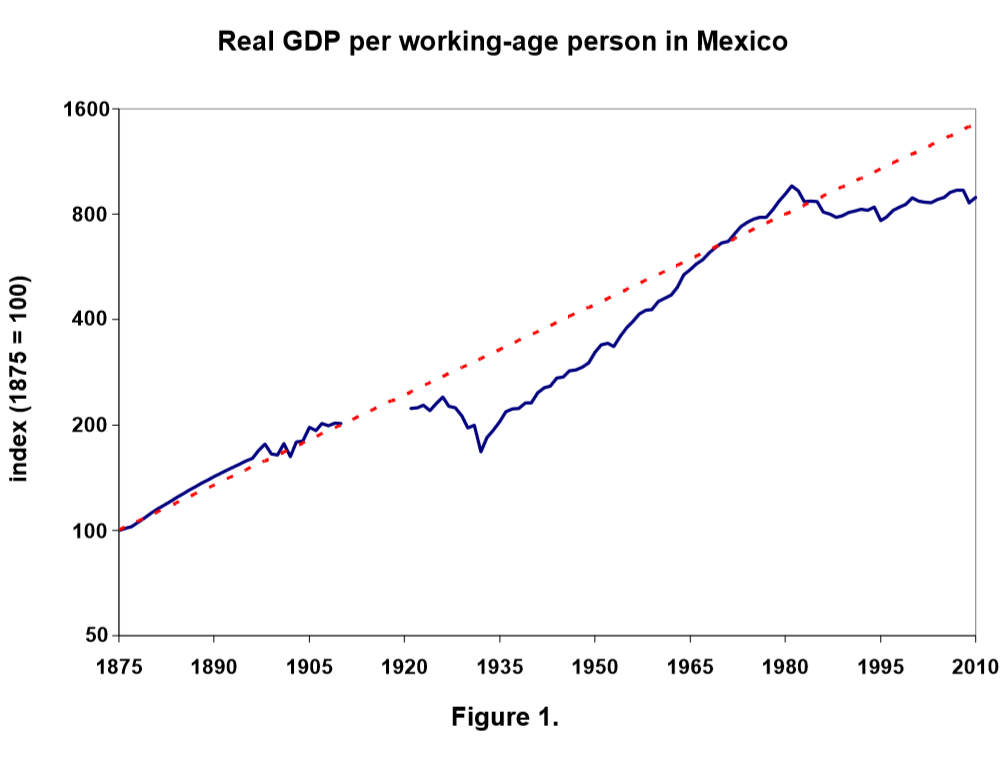
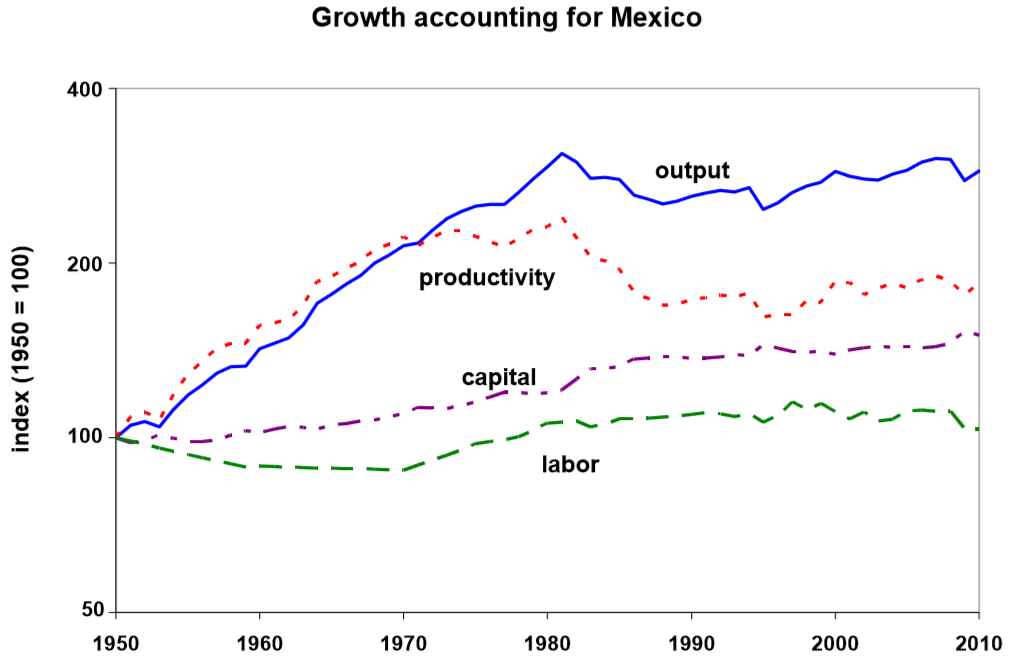
If it’s Japan’s population size which makes Japan’s stagnation such a disproportionate topic of discussion in the English-speaking world, then I know a country of 124 million people who’s productivity stagnation has been longer (by a decade) and much, much harder than that of Japan, and which is thousands of miles nearer to the U.S., and whose stagnation is much less discussed: Mexico:
But why does the former Sick Man of Europe and the present Healthy Man of Europe, Germany, have a similar history of GDP/worker rise and stagnation as Italy, only milder? From the data, it seems that Germany has been holding on to manufacturing jobs harder than the United States. My first thought was guessing working hours fell harder in Germany, but that turned out to be precisely the wrong explanation. The idea that Germany’s falling behind the U.S. in output per worker is due to different labor market fates in these countries is contradicted by a lot of the German productivity stagnation taking place before Germany’s labor market sclerosis began to subside in 2005. So my present guess is that Germany has been falling behind the United States due to its failure to move quickly from manufacturing into high-value-added services. Perhaps most of the Axis productivity stagnation can be explained via three factors: over-reliance on high-wage manufacturing, insufficient labor market churn, and an aging, more risk-averse working population.
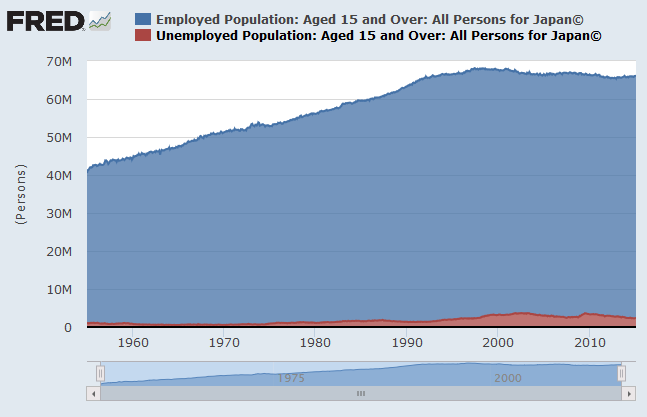
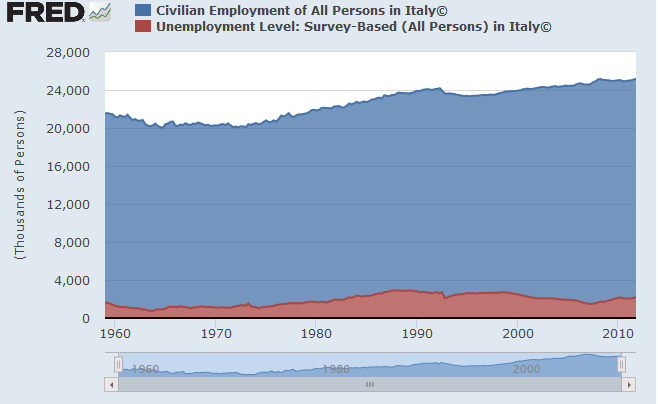
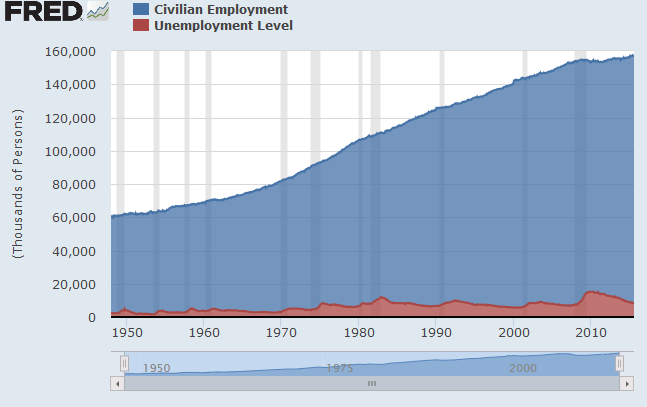
It now seems time to give some charts of the labor force sizes of the Axis countries, as well as that of the United States:
Nothing here to clearly relate to productivity differences. Aw, well.
From these charts, it seems clear that variation in unemployment rates between countries really is mostly a structural issue, not one related to the rate of growth of the size of the labor force.
1. Holy privacy violations, Batman! While Google has only become evil in the past decade, Microsoft has never stopped being evil. There are a whole lot of data transfers from Microsoft to you and from you to Microsoft set as default in Windows 10. Among these are mandatory Microsoft updates (both security and non-) and (voluntary) contributions of all sorts of data from you to Microsoft. Cortana (Bing voice search, basically) I have neither used or enabled, as I consider it too invasive to turn on.
2. Metro Internet Explorer is gone. What’s the point of Tablet Mode with no Metro Internet Explorer? And Edge is hardly a great tablet browser like Metro Internet Explorer was.
3. With Microsoft Edge, Microsoft has narrowed the gap with Firefox&Chrome almost by half. Unlike Internet Explorer, at least it loads all the content in a webpage with some reliability. It also has the most attractive desktop user interface of all the major browsers. Edge also has a very good built-in PDF rendering function, thus making it the default PDF viewer in Windows 10. However, there is no “Open File” button in Microsoft Edge that I can find, so I don’t see why Microsoft made it the default PDF viewer while omitting this feature. This PDF rendering capability, however, was also brought to Microsoft’s Reader App in an update around July 28, so there’s no need to upgrade from Windows 8.1 to 10 just for this feature. Edge is a memory hog like no other. At present, when I have only eight tabs of Google.com open, Edge is using nearly 400 megabytes of memory. Also, for some reason, Edge does not deal well with horizontal scrollbars in webpages. It also continues Microsoft’s four-year-long tradition of interpreting blatant search terms as addresses. I would suggest sticking with Firefox or Chrome for now. Microsoft has been routinely bad at improving and innovating web browsers since 2003 (the nadir: Internet Explorer 8).
4. The added user-friendly displays of disk space and Internet activity in the Settings App look nice.
5. The Tablet Mode has some good parts, but is not yet a clear improvement on 8.1. The Task View is definitely an improvement on 8.1. The Start Screen is slightly improved (it has more empty space, but there’s more freedom in moving the tiles). The permanent taskbar is obviously a replacement for the Charms (it should have been an impermanent taskbar, which would have been called up in the manner of the Charms), and Desktop programs opened in Tablet mode have occasional difficulties in automatically opening new windows. This makes it difficult to recommend it for either tablet or desktop users. There’s also the curious omission that desktop apps cannot be split-screened, but they couldn’t have been split-screened in Windows 8.1, either. Also, as all desktop apps are fullscreen in Tablet mode, even if they were never designed to be, the Tablet Mode may be somewhat worse than the barely-sensible desktop-as-an-app system in Windows 8.1 at displaying desktop apps.
6. The Start Menu is clearly a redeeming feature in Windows 10. It replaces the desktop in Windows 10 tablet mode, and works similar to the Windows 7 Start Menu in Desktop mode. There are live tiles in the Start Menu. The location of the live tiles is much more customizable than it was under Windows 8.1. The list of programs is vertically scrollable in All Apps view and is accessible from Start.
7. The twice-renamed Zune Music and Video apps and the XBox App need to be uninstalled (and not re-installed again) by PowerShell commands if they are ever to be uninstalled (and not re-installed again).
8. There is a multiple desktop feature in Windows 10. This allows the intuitive opening of multiple processes of the same program, one in each desktop. This is unique to Windows 10.
9. The ability to create a Guest account has been totally removed. Of course, this is avertable by making the signin an image that’s extremely obvious to figure out to guests.
10. The Windows DVD player is only available free for one year, and is very limited. Seriously, I have no idea why it exists (or why Microsoft is charging for ad-free Solitaire and Minesweeper).
11. The ability to display Metro apps in the desktop is nice, but there’s no way to make some of them fullscreen! The Photos app, for example, does not display genuinely fullscreen in Windows 10 the way it does in Windows 8.1, and, indeed, looks kinda ugly. The split-screen mode in Windows 10 is neither better nor worse than in 8.1.
12. The default OneNote app has suffered a massive feature downgrade, as is readily visible from the comments in the Windows App Store, especially for tablets.
13. Windows 10, unlike Windows 8.1, allows you to sideload Windows Store apps without a license.
15. Update: Windows 10 also has a resizeable Start Menu and a better Snap view (corner-snapping!), which I haven’t noticed before. This makes an upgrade more tempting. Edge has also improved. Fast Startup (from hibernation file) came to 8.1 during the week of the release of Windows 10.
In short, there are too many downgrades for me to decisively recommend Windows 10 over 8.1. I certainly don’t recommend Windows 10 over 8.1 on any touch-centric device (including Windows Phone), and will probably not ever do this, as Microsoft seems to have de-emphasized touch permanently. So I’m temporarily switching back to 8.1 on my main computer (this is only allowed for one month after Windows 10 installation) until Microsoft either ends its customizability removals, improves Edge to the point it’s recommendable over Firefox or Chrome, or offers some other decisive new feature making Windows 10 superior to 8.1. I recommend the Windows 10 upgrade only for Windows 7 users, as it allows them to install Windows Store apps. For Windows 8.1 users, it offers no decisive advantage. Windows 10 is a work in progress, and may be decisively superior to Windows 8.1 sometime in the future. But Windows 8.1 is an established operating system, with less uncertainty about its features or lack of them. I’ll probably go back to Windows 10 by July 2016, if only to experience new features missed out on by Windows 8.1 users in the distant future. But if Microsoft continues limiting Windows 10, I’ll doubt I’ll ever go back to it.
Update: I have gone back to Windows 8.1. All programs I’ve installed after switching to Windows 10 are gone. All my Firefox history remains. I forgot to mention that Windows 10’s startup time (from power button to lock screen) is much faster than that of Windows 8.1, not to speak of Windows 7.
Update 2: If some Windows Store apps aren’t installing after the reset (esp., Fresh Paint, OneNote, Tubecast), you may need to install the Flixter app for reasons specified here.
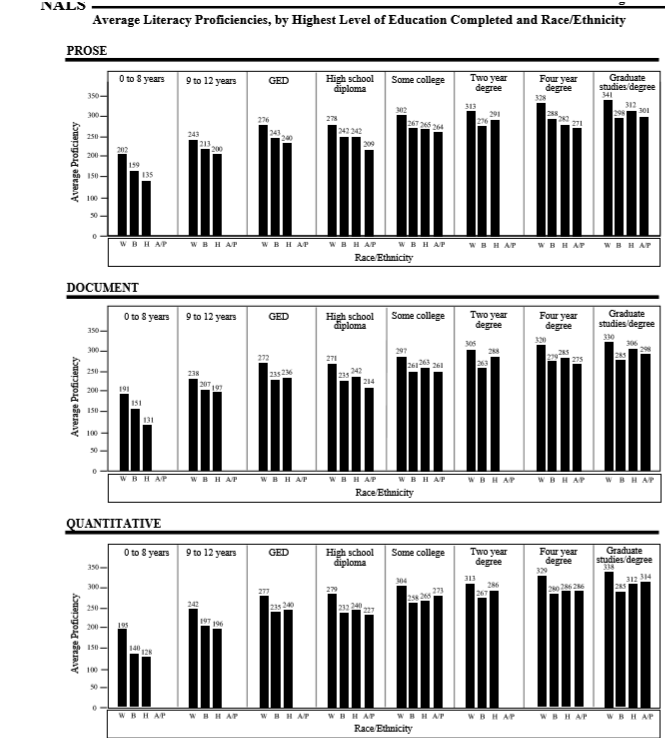
James Flynn, a famous psychometrician, once wrote a book entitled Asian-Americans: Achievement Beyond IQ. In it, he argued that Asian-Americans, especially East Asians in the U.S., experienced much greater occupational, educational, and other achievement than could be justified by their IQ scores. What he neglected to point out was that this applied for Mestizos and Blacks in the U.S., as well. So the real issue was not and is not Asian-American achievement beyond IQ, but Euro-American IQ beyond achievement: This is as of 1992, before the great wave of high-skilled Asian immigration to the U.S. But it’s still interesting to look at how at every level of education, in every area of knowledge tested, on average, Whites are always #1. Got any ideas why?
Hat Tip: Sean Last of The Right Stuff (.biz).


